Attribution is flawed and econometrics is expensive.
At least, that’s the debate that’s in full swing on LinkedIn.
Thankfully, the choice isn’t one or the other.
Because attribution doesn’t replace econometrics.
Attribution focuses on the touchpoints in the customer journey and it’s essential for short-term optimisation.
And econometrics looks at the relationship between variables such as brand awareness or seasonality and it’s essential for understanding the impact of advertising on sales.
Instead of asking ChatGPT to write today’s email comparing attribution to econometrics, I’m writing about my favourite tool in the econometrics toolbox: Response Curves.
Advertising Saturation Points and Response Curves.
You’ve hit a saturation point when further advertising efforts become ineffective or even counterproductive.
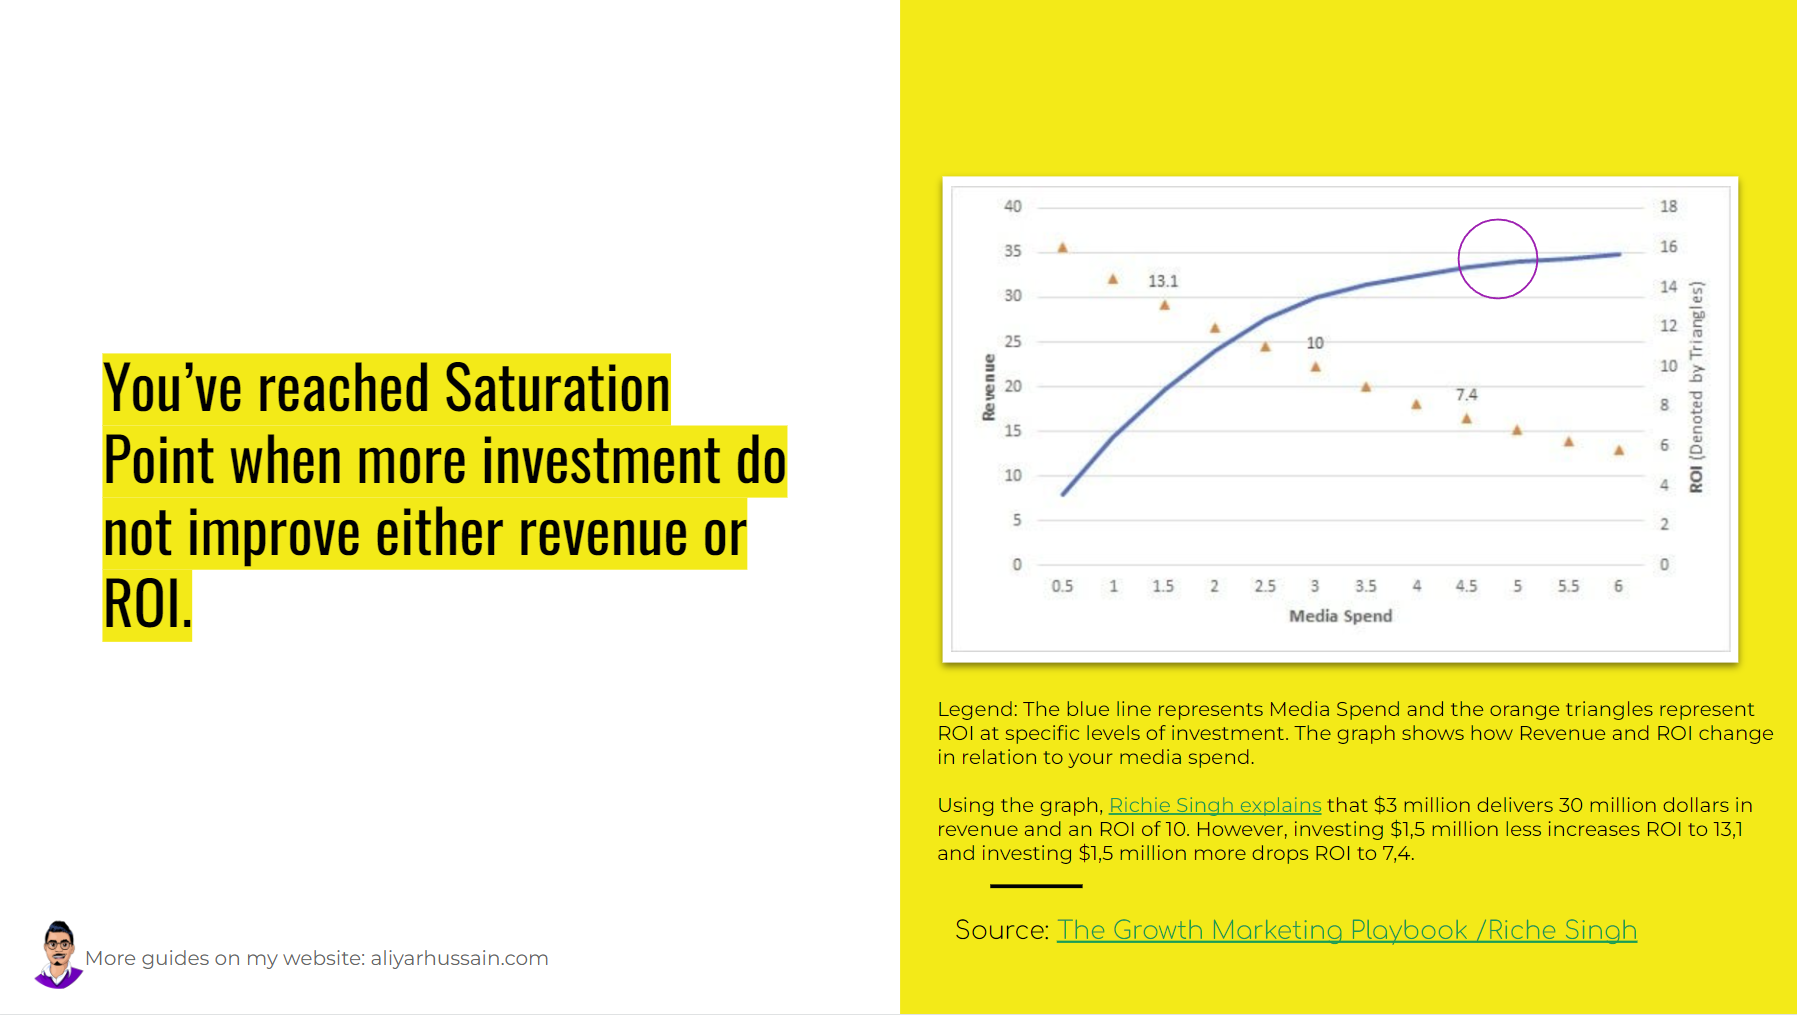
And a response curve reveals the saturation point by showing you how much growth you can get from incremental media investments.
‘Incrementality’ is the growth that can be directly linked to marketing efforts above and beyond the existing brand equity and existing sales activity.
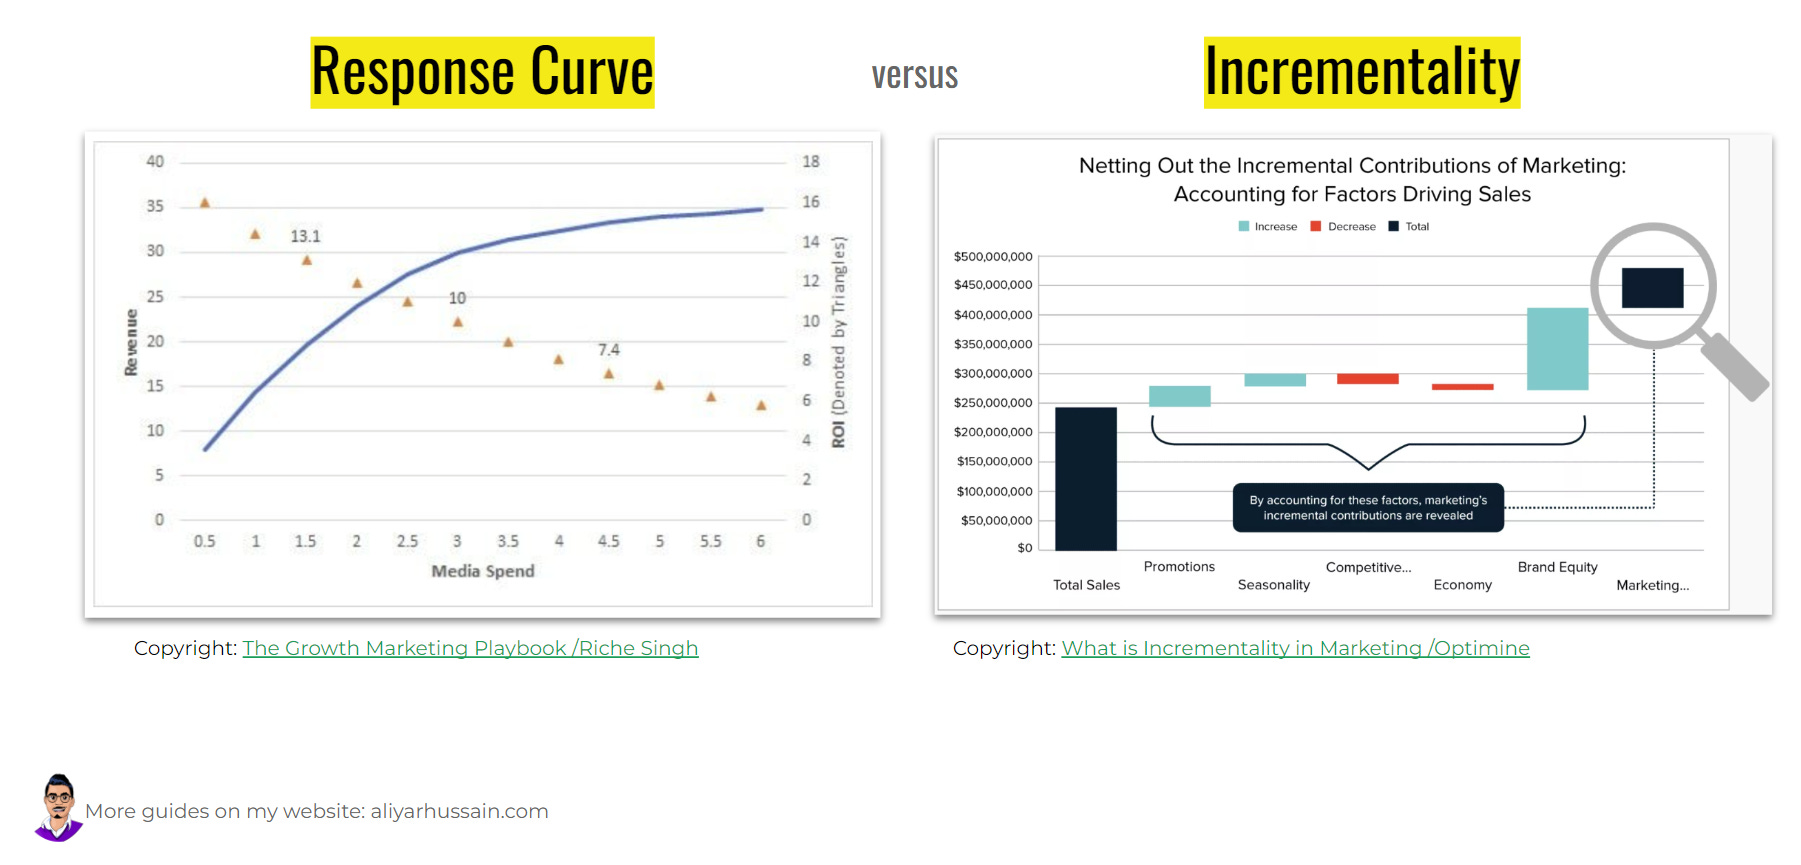
Econometrics uses Response Curves to model the effect of advertising on revenue.
This example (left chart) is from Richie Singh’s article on Medium. It shows the effect of advertising on ROI and Revenue over time.
The blue line is media spend and the orange triangles represent ROI at specific levels of investment.
In this example, $3 million in media investment delivers 30 million dollars in revenue and an ROI of 10.
However, investing $1,5 million less increases ROI to 13,1, and investing $1,5 million more drops ROI to 7,4.
And the incremental gain from advertising peaks at $5 million and ROI decreases significantly.
How Response Curves help with optimising your media investments.
There are three types of response curves that you will come across in the wild.
The most common of them is the S-Curve.
The S-Shape means that you need to first invest to build momentum e.g. brand awareness before you start seeing growth.
Building a long-term sustainable effect of advertising takes time.
And impatience is the main cause of why so many fall back on attribution.
The other type of response curve that you’ll see commonly is Concave. A concave curve happens when advertising creates a strong response quickly that starts to diminish over time. Finally, it saturates.
Linear response curves mean that advertising is having a direct effect on growth. They are also the most coveted and the rarest to happen in the real world.
If you’re getting a linear response curve then check the quality of your model before you start celebrating.
Response Curves help us understand the impact of advertising in three ways.
- Response curves help us model Diminishing Returns. It’s the point after which further advertising doesn’t produce any incremental growth in sales. Beyond this point, more advertising can start eating into your margins.
- Response curves help us model Ad-stock. It’s the length of time over which the effect of advertising last after the campaign is over. Brand-building campaigns usually have a longer adstock than activation campaigns. In both cases, the effect decays over time.
- Response curves help us model Lagged Impact. Just as your ad stock decays over time, it can also take some time to cut through the noise before you see any effect from advertising.
Beyond improving your ‘data-driven marketer creds’ x1000, response curves can help you see how changes in your advertising strategy might impact your business in the future.
And using econometrics with attribution can help you make better decisions about where to invest your resources.